In June 2016 I attended the 28th FIRST Conference and watched a very interesting talk by John Matherly (@achillean) and Eireann Leverett (@blackswanburst) titled “A fistful of metrics” (PDF).
Using Open Source Intelligence (OSINT) and Shodan.io they made an interesting comment whereby you could measure the amount of newly installed wind turbines, compare this against public company projections and buy/sell stock accordingly.
Around the same time Risky Biz interviewed Nik Cubrilovic, exposing some very interesting ways companies are using these techniques to capitalise on OSINT.
Being fascinated by the concept, it danced around in my head for the next few years. Finally I decided to try a little experiment. I wanted to see if I could find a correlation between the stock price of a company and an easily obtainable OSINT fact.
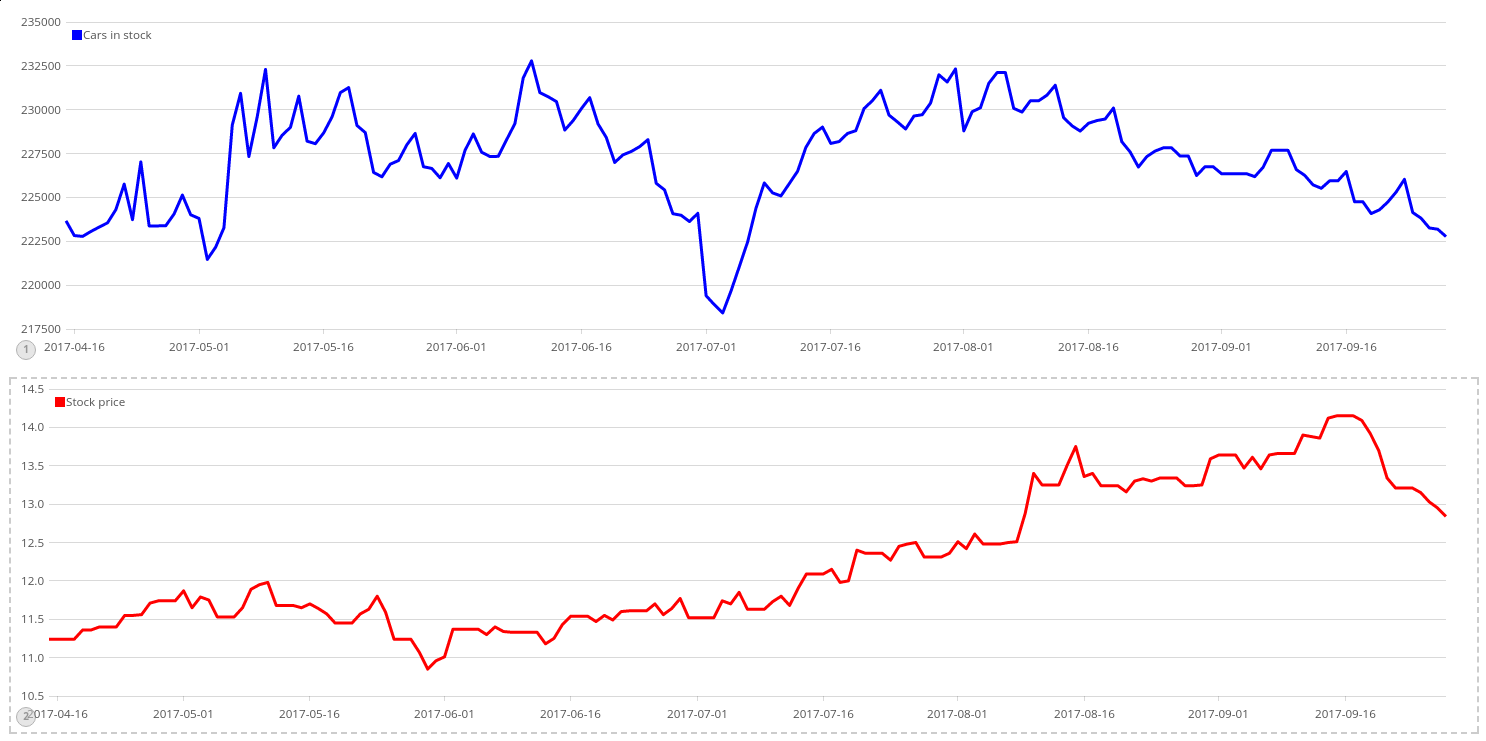
I chose the popular Australian car classified site carsales.com.au, monitored its stock price (CAR.AX) along with the number of cars for sale.

Writing a few scripts, I stored these statistics in an ELK instance. Unfortunately I lost all data prior to April 2017 due to a system failure, however I graphed both together and could see no apparent correlation:
This type of OSINT analysis will only become more prevalent as companies continue creating “smart devices”. Although this data did not show any correlations, I’m going to continue these experiments in future to see what else can be discovered.